A tbl_mbte is passed. It is assumed, that the table is ordered
(panels to draw first are at the top of the table). The contents of the
panels (subplots) to draw are determined by the grouping specified in the
ellipsis (...). Since the number of panels to draw may not fit onto
one plot (can only contain nrow * ncol elements), panels are split
onto mulitple "pages". This is done by returning a list, where each element
is a ggplot2-chart, showing a subset of the data to plot.
mbte_panel_plot(x, expr, ..., nrow = 3, ncol = 4)
Arguments
| x | A |
|---|---|
| expr | An expression to generate one panel of the plot (gets quoted) |
| ... | Variables used for grouping (get quoted). |
| nrow | Number of rows per page. |
| ncol | Number of columns per page. |
Value
A list of ggplot-objects.
Details
The user should pass a quosure as expr,
which specifies what should be drawn in a panel/subplot. It can make use of
the following masked objects:
- .u_signals
Unnested signals (see
mbte_unnest_signals)- .u_fits
Unnested fits (see
mbte_unnest_fits)- .time_sym
Time variable as a
symbol- .value_sym
Value-variable as a
symbol- .n_pages
The total number of pages, that will be printed
- .n_page
The number of the current page (when evaluating
expr)
Note
.u_signals and .u_fits are only available if the `signal`
and `fits`-columns are present.
See also
filtered_signals (dataset used in examples),
facet_wrap
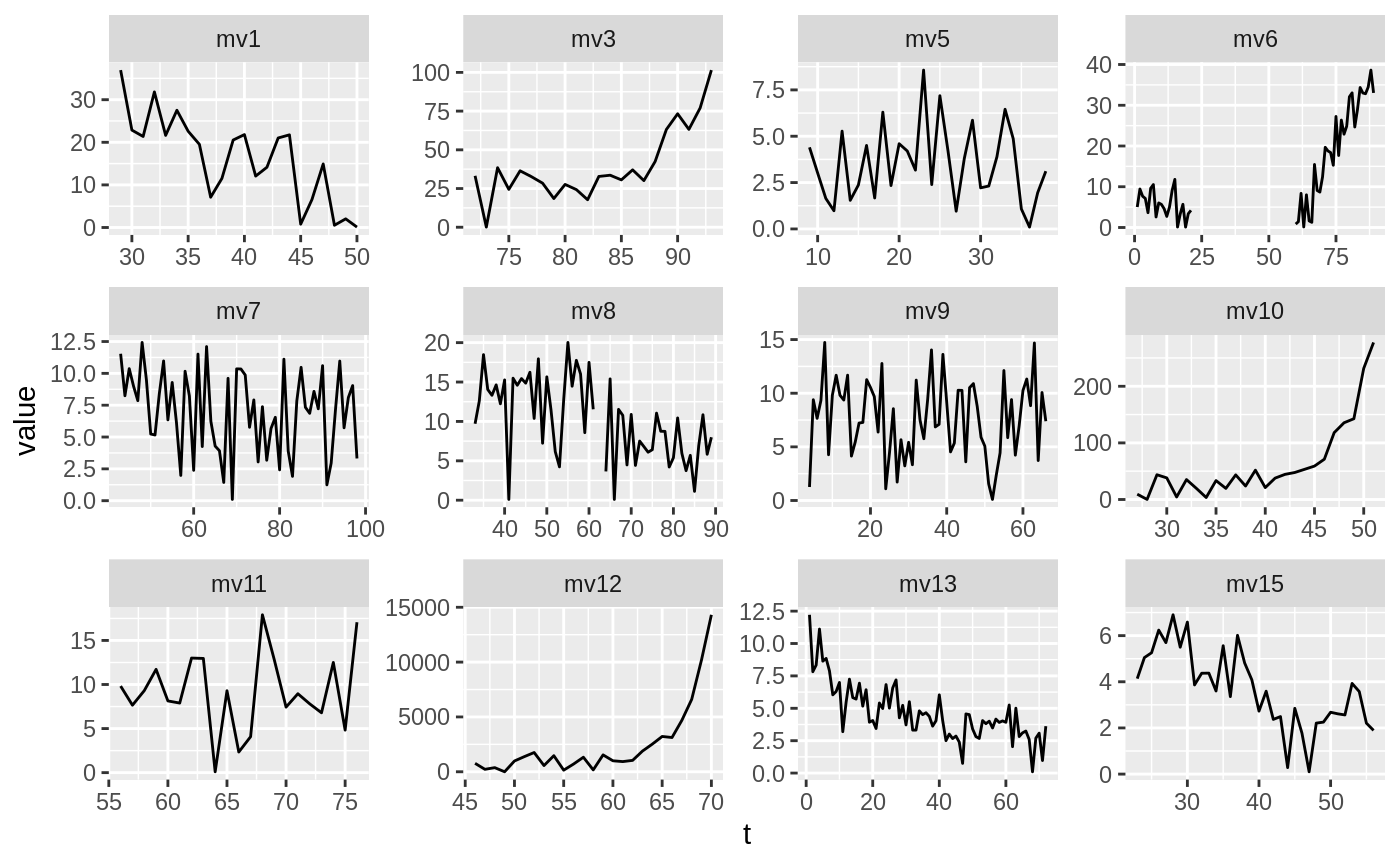
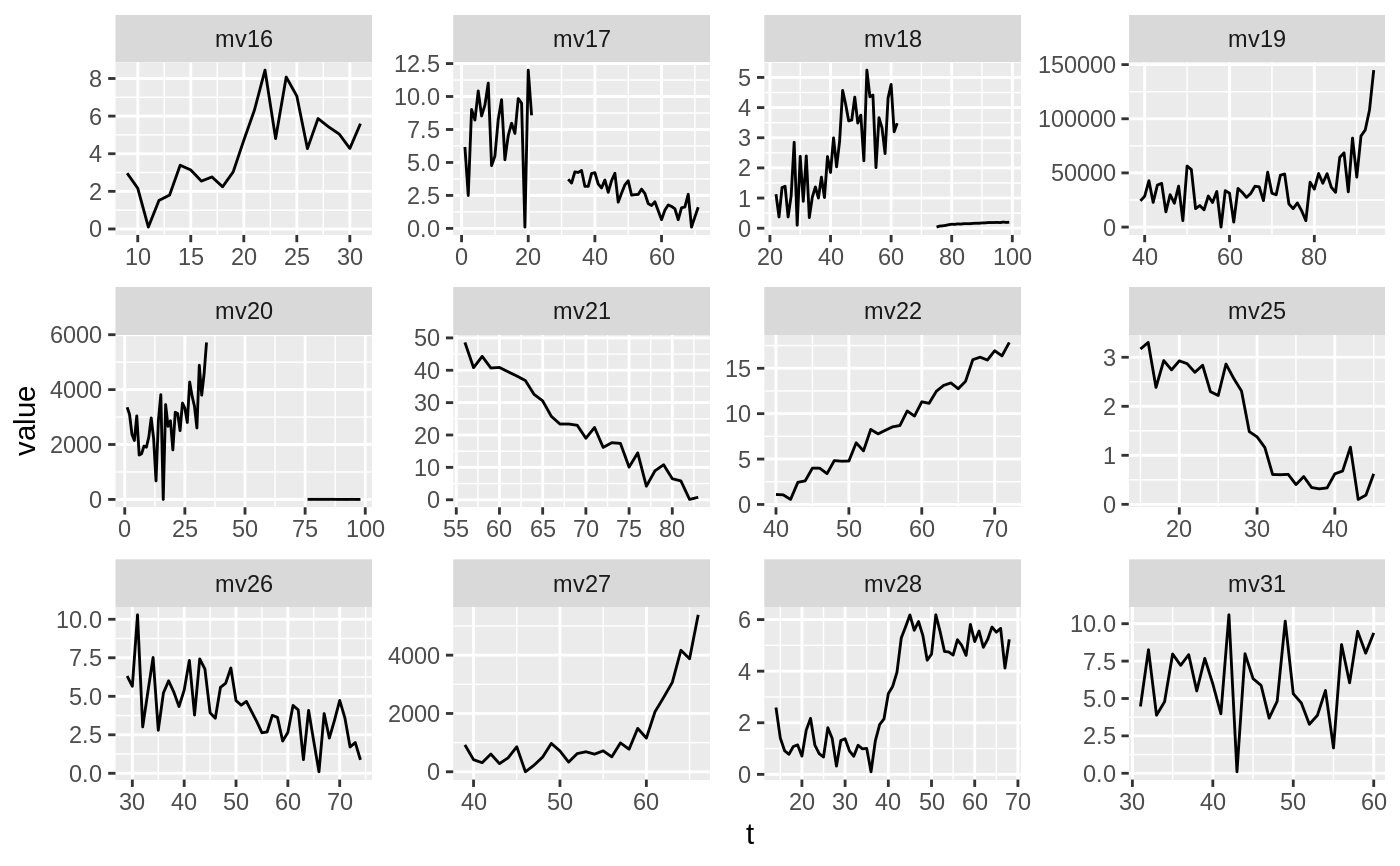
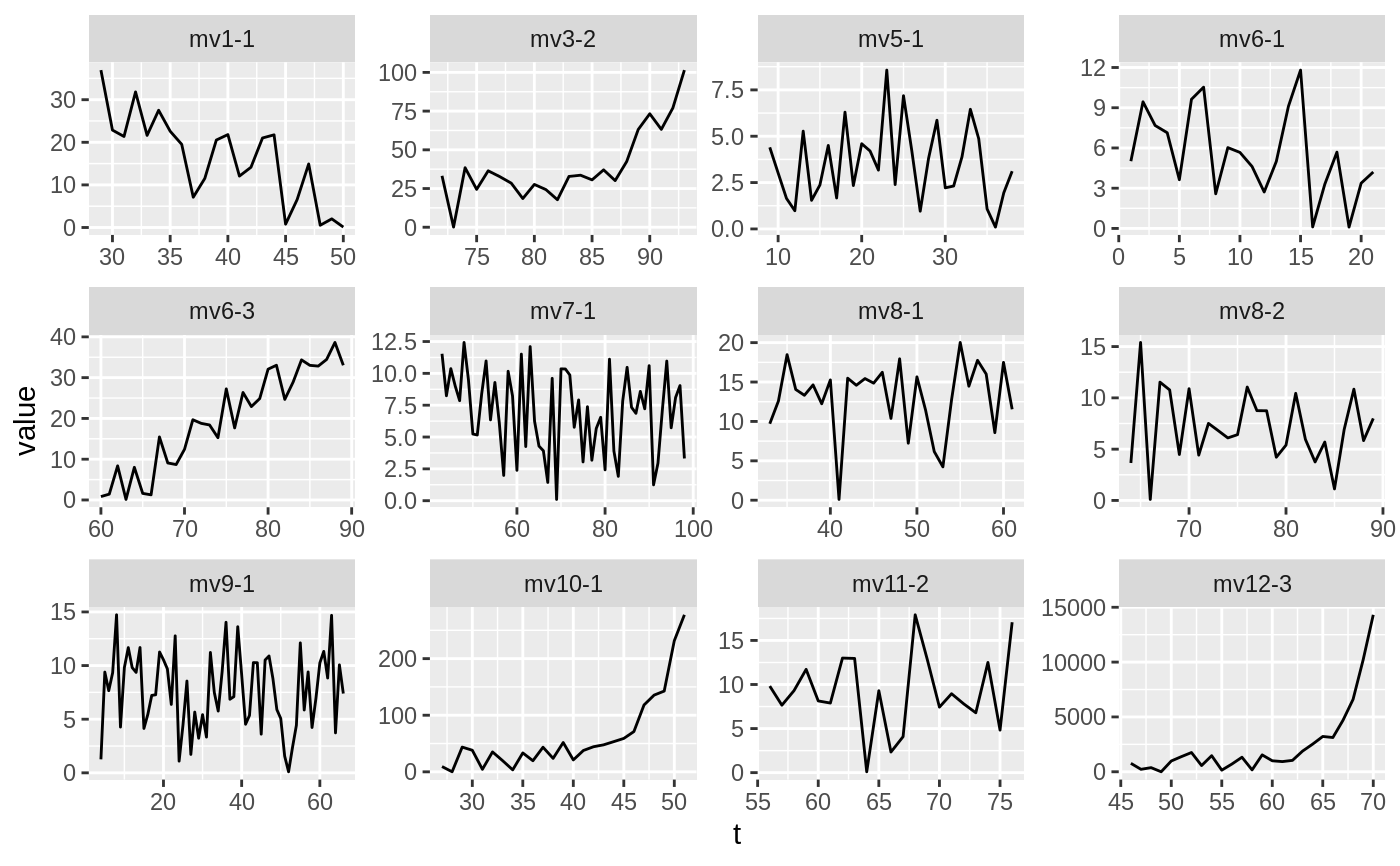
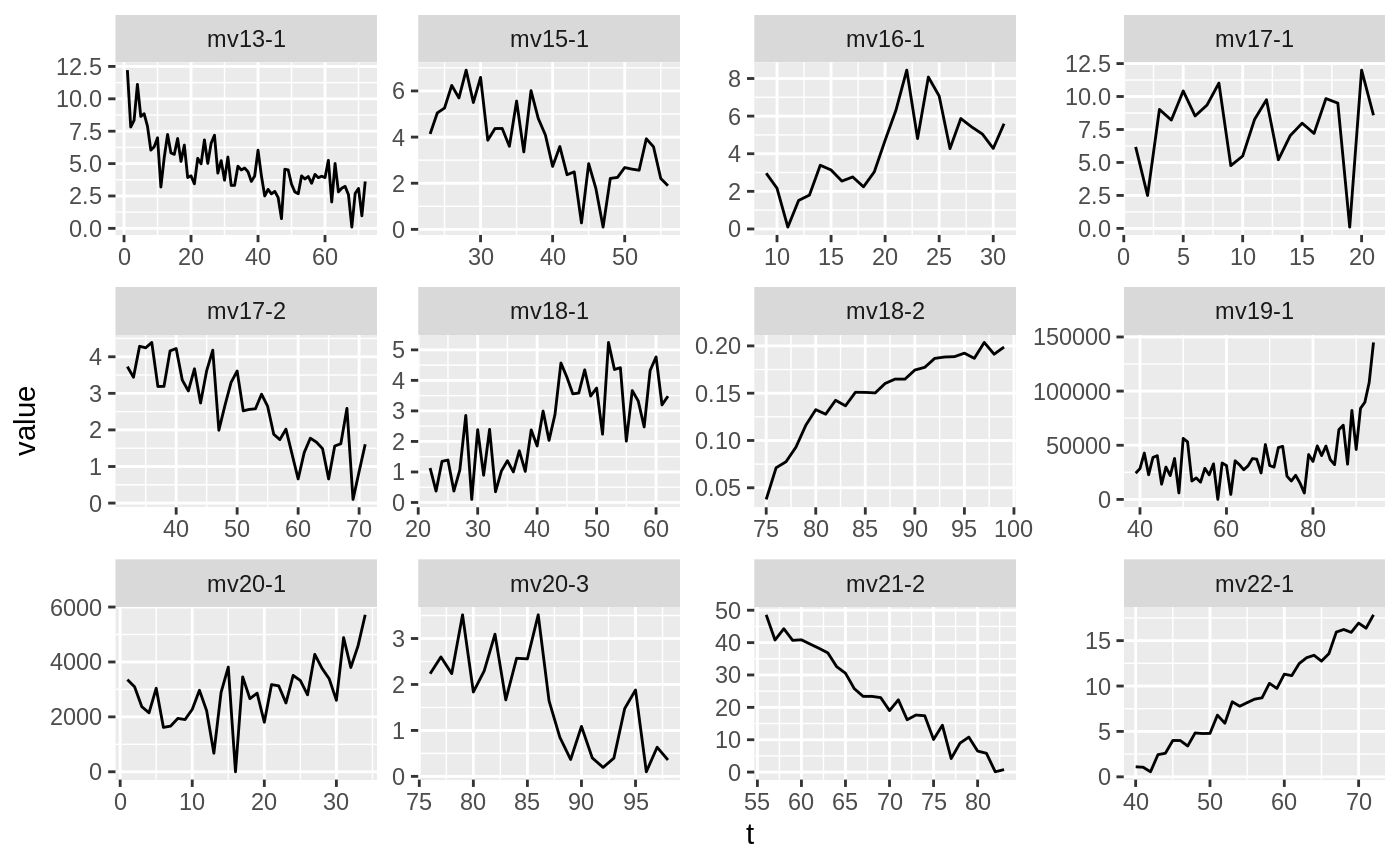
Examples
#> # A tibble: 37 x 3 #> mv signal_nr signal #> <chr> <int> <list> #> 1 mv1 1 <tibble [22 × 2]> #> 2 mv3 2 <tibble [22 × 2]> #> 3 mv5 1 <tibble [30 × 2]> #> 4 mv6 1 <tibble [21 × 2]> #> 5 mv6 3 <tibble [30 × 2]> #> 6 mv7 1 <tibble [56 × 2]> #> 7 mv8 1 <tibble [29 × 2]> #> 8 mv8 2 <tibble [26 × 2]> #> 9 mv9 1 <tibble [63 × 2]> #> 10 mv10 1 <tibble [25 × 2]> #> # … with 27 more rows# Draw a graph grouped by the measurement variable (multiple subsignals will # be displayed in one panel/subplot). plots <- mbte_panel_plot( x = filtered_signals, expr = { # expression for the content a subplot/panel # NOTE: `.u_signals` is provided by masking ggplot(.u_signals, aes(t, value)) + geom_path(aes(group = signal_nr)) }, mv # grouping varibales ) # only show 2 "pages" head(plots, n = 2)#> [[1]]#> #> [[2]]#># Now grouping by measurement variable (measured parameter) and signal_nr is # performed. plots <- mbte_panel_plot( x = filtered_signals, expr = { # NOTE: Using a grouping aesthetic is not necessary, since only one line # per panel will be drawn (because a signal in the used dataset is # identified by the `mv` and the `signal_nr` column). ggplot(.u_signals, aes(t, value)) + geom_path() }, mv, signal_nr # grouping variables ) # only display 2 elements of returned list head(plots, n = 2)#> [[1]]#> #> [[2]]#>